I’m Isabel Evans, and my research is about the experiences of testers with tools and automation. I’ve been investigating “Who is testing? What are their backgrounds, experiences, training and readiness for a role including testing?” My data includes the experiences of over 250 testers world-wide. It is giving insights into their demographic spread and the complexity of their roles. I’ve found that people who test come from many backgrounds and have sometimes surprising earlier careers and interests. People who test are not “just testers…” Because at present, many testers do not feel well supported by their tools. As the research uncovered stories of frustration, fear, and anger, I realized the illusory role of usability in tool adoption and the importance of understanding who is using those tools. A better understanding towards tools that better support testers.
Highlight Points You Will Find in This Article
Testers come from a wider range of backgrounds, and have complex multifaceted roles
Test tools does not always support testers well in achieving their work goals
This can lead to frustration and to the rejection of the tools
Improving usability of the tools is only part of the answer
Getting It Wrong… Then Following the Data
I’ve been working in testing since the 1980’s, and since 2017, I’ve been collecting testers’ stories to understand their characteristics, experiences, and work styles, as well as their experiences with the tools they use. I’m doing that to help improve the way tools support testers. But, when I started out it was in quite the wrong direction…
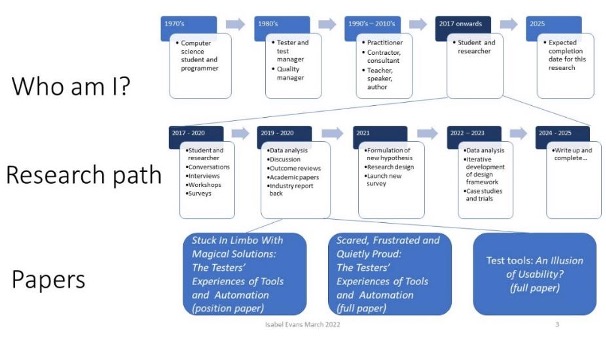
Figure 1: Isabel’s career and research path from the 1970’s to the 2020’s
In 2015, I was working in industry—as a tester, a test manager, a consultant, and a trainer. I could see trends in organizations, at conferences, and on social media discussing test tools and the possibility of test automation. There was increasing pressure to automate test execution and discussion about whether that was possible or desirable. There was a move for testers to increase their technical and programming skills, and a discussion on usability of tools. I wondered if increasing the usability of tools would enable a greater diversity of people to take part in testing; including people with business domain knowledge rather than with technical knowledge. I had decades in the industry, as a computer science student, a programmer, and then from the 1980’s onwards a practical life in testing and quality (see Figure 1). In 2017 I became a postgraduate research student at the University of Malta to research the experiences of testers with their tools in a rigorous and disciplined manner.
So far, I have collected data from over 250 participants world-wide with mixed demographics and experiences. The stories they have given me have been surprising and insightful. This data has come from interviews, workshops, and anonymous surveys. I’m continuing to collect data and analyze it, and each round of qualitative data analysis reveals more and builds my understanding. The analysis is qualitative in nature—that is I am mining the details of people's stories and listening to their voices. For qualitative research, this is a large sample size.
It’s Not a Simple Picture…
The data shows that the answers to the simple questions “Who is testing?” “How are they testing?” and “What tools do they need?” are not simple.
Having set out to look for usability problems by asking a very open set of questions (see table x) in the first studies, I uncovered a much richer seam of information than I had expected. By following that seam of data and listening carefully to the people testing, I was able to dismiss my previous hypothesis and formulate a new one. The usability of tools is only part of the problem—and attempts to improve usability, perversely, can sometimes make the testers’ experience of the tool worse, not better. From examining the data, I had the realization that the testing community is very varied and the tools provided don’t suit everyone. We need to make the tools more people-centric. And it’s likely that tools designers may need guidance in how to do that—a better understanding of who is testing and their goals to supply tools that are people-centric rather than tech-centric. It is not a trivial task to design tools that are suitable for people testing software—tools that really will support them. In the next sections, I’ll explain why and how I developed the idea of a People-centric, Evidence-based, Design Framework (working title “the PEDF” but further down the line I will think about a fun acronym!), and how I am going about building the framework (Figure 2).
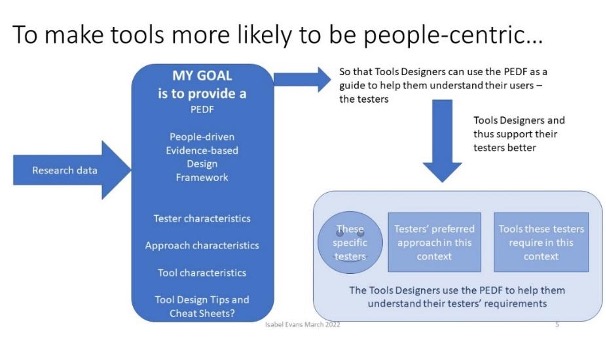
Figure 2: The current vision and goal for the research – arising from the data so far analysed
What Is a Tool? I Don’t Just Mean Automation
When you ask people what tools they use to support testing, they will provide a list of—often well-known—tools that are provided through tools vendors or open-source communities. Tools are in-use to provide some support to many parts of the testing activity, not just the automation of test execution. Different tools support how we analyze the data collected during testing, how we report it, how we plan testing, how we assess risks, and how we communicate within and across teams. Some of those tools are software tools, and some are not. In this study I have allowed the people telling their stories to provide their own ideas about what is a tool, so I can better understand what they mean. At present, I am keeping an open mind, later I may attempt to categorize, or I may adopt a categorization from elsewhere, if it fits the data.
The people who test face challenges…
As I started to analyze the data from the first interviews, workshops and surveys, I realized two things: people described multiple challenges and they were experiencing a higher level of emotion than I expected. You can see some quotes from their stories in Figure 3 and Figure 4.
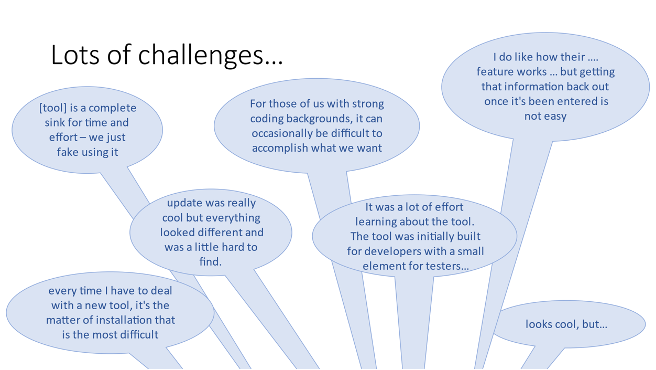
Figure 3 Selected Quotes from the Testers’ Stories - Challenges
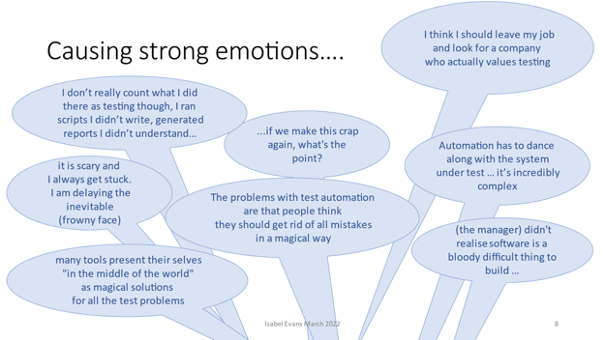
Figure 4 Selected Quotes from the Testers’ Stories - Emotions
Testers commented on how tools—apparently implemented for improving efficiency—waste their time and increase the efforts they must make. They describe not being able to easily install and configure tools, not being able to work collaboratively, not being able to communicate their data easily. Usability did feature very frequently in people’s comments, both as a desirable attribute of a tool and as a challenge to successful tool use. However other technical attributes of the tools, including the inability to maintain test sets over time, security blockers to accessing tools, poor tool reliability, and poor tool performance were all mentioned as blockers to success. The poor interoperability of the tools was mentioned by several people as a blocker to information sharing across the team, and as a cause of wasted effort.
Topic of concern | Frequency |
Usability / quality in use | 511 |
Technical | 466 |
Management / organizational | 377 |
Issues and challenges | 232 |
Table 1 Frequency of Topics of Concern raised in the 2018 Study
In the first 111 respondents to the 2018 survey, 232 separate issues and challenges to successful tool use were raised (Table 1). Having analyzed 111 survey responses, I noticed something that I had not expected: a surprising number of respondents did not just relate an objective, dispassionate account of the use of a tool. Instead, many of the respondents were exhibiting strong emotions. I rechecked the data, and asked two other researchers to also review the data. In all, 35% of the survey responses showed emotions. Figure 5 shows part of the spreadsheet used during the analysis, where I was tracking instances of emotional response by participant, by survey question, by relating issues to emotions, and by looking at both positive and negative emotions. While some respondents showed no emotions, others were emotional, even passionate in their responses. Table 2 Lists the survey questions and the number of emotional responses.
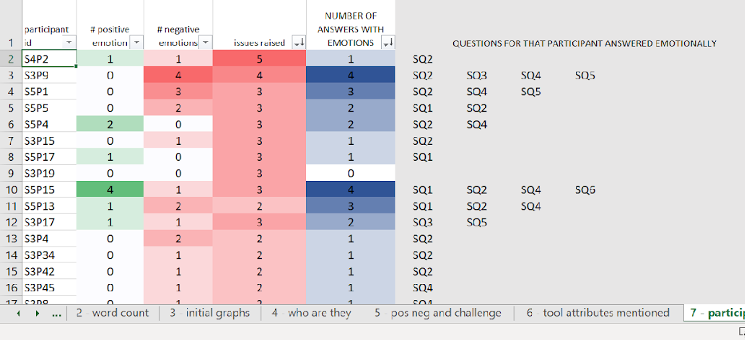
Figure 5 Part of the Emotions Spreadsheet During Data Analysis
| Question | # emotional responses | # times positive | # times -negative |
SQ1 | Tell me a bit about yourself | 7 | 3 | 5 |
SQ2 | Tell me a story about tools | 25 | 6 | 22 |
SQ3 | Was it easy or difficult? | 6 | 1 | 5 |
SQ4 | Have you ever avoided using a tool? | 12 | 2 | 17 |
SQ5 | What are the characteristics of a good tool? | 3 | 1 | 2 |
SQ6 | What tools are used in your organisation? | 3 | 4 | 4 |
SQ7 | What tools do you use? | 0 | 0 | 0 |
Table 2 Survey Questions in the 2018 Study, and Emotional Responses
What is happening here? And why does it matter? I started to reflect on not just what the tools were for, their usability and their technical attributes, but the effect that technology has on the people that use it. People felt “stuck in limbo” because of tools that prevented their work progressing. They suggested that organizations and managers adopted tools in the belief they are “magical solutions” to all problems. Their emotions ranged from negative (scared or frustrated) to positive (expressing pride in what they had achieved). Some felt a sense of complete disempowerment. Yet tools can promise increased effectiveness and efficiency.
A Good UI Is Not Enough to Guarantee Happiness…
Some of the comments made about tools indicate that tools with appealing user interfaces (UIs) were disappointing, delivering poor support to testing. Testers noted that tools “Look cool but…” and went on to describe inflexible workflows, poor test maintainability, and poor interoperability. The designers for these tools had focused on the user interface (UI) more than on the support to the testers carrying out their activities and providing a great user experience (UX) (Figure 6).
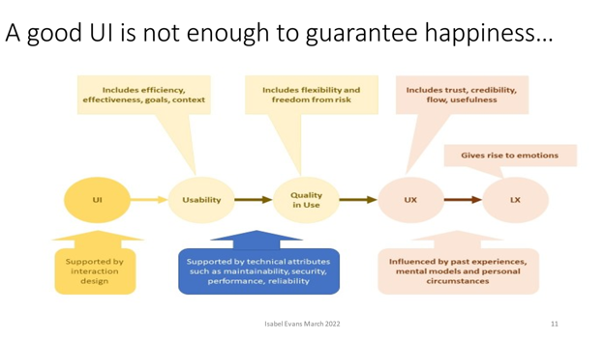
Figure 6 Good User Experience is Built on More Than the UI Design
The UI is important and should be supported by well thought out interaction design. A good UI contributes to usability, and thus to UX, but is not the whole story. Usability includes the UI design, and also considers the person’s goals and context to make the person both effective and efficient in the achievement of their goal. This means understanding the person’s workflow, and work choice, as well as their skill level. While some IT practitioners I have spoken with equate “usability” with “ease of use” and “learnability” it is important to realize that those are only part of what a tool designer needs to consider, and how one interprets both is highly dependent on the context of use, and the skill level of the person using the tool.
While usability design is vital to provide the right support to the person using the tool, it is not enough. The tool designer also needs to consider the “Quality in Use” of the tool. Good usability is married to technical attributes such as maintainability, security, reliability, performance, and interoperability to support the testers’ flexibility and their freedom from risk.
Quality in Use attributes combine with the overall experiences of interacting with the tool and tool provider building the testers’ perception and experience of trust, credibility, flow, and usefulness, to provide the overall UX for the tool. UX Design looks at all these factors. The emotional response of someone using a software tool is influenced by the UX, and by their past experiences to provide their lived experience (LX). For testers, let’s call that TX: the testers’ experience of their tools and automation.
Focusing on the UI and superficial ease of use provides only the illusion of usability. And providing only an illusion of usability increases frustration, and leads to a poorer tester experience. If, when designing a tool, we think about attractiveness rather than usefulness, we provide something that looks good but is not worth using. If we focus on only one user group, or we design personas superficially, we are in danger of designing a tool where learnability and flexibility are in opposition. Not understanding the personas means we may not support change and growth for the people using the tool. If we don’t provide Quality in Use we neglect maintainability, performance, security, etc. and we design a tool that is not supportive in long term use.
It seems necessary to understand the testers’ personas in more depth, not focusing so much on groups by job title, but by their goals, challenges, and preferences. This is the reason for my current research: to understand WHO is testing, HOW they are testing, and therefore what tools they need to support them. Testers are not just testers, they come from multiple backgrounds, they have responsibilities beyond testing, and they have a variety of preferences for how they work.
Testers Are… Not Just Testers
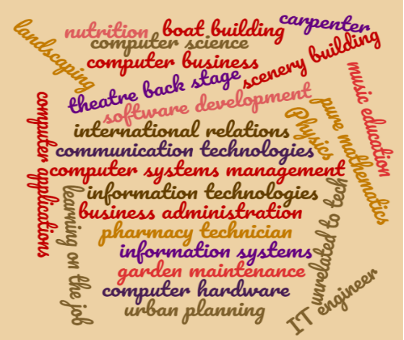
Figure 7 Backgrounds of 2018 survey respondents
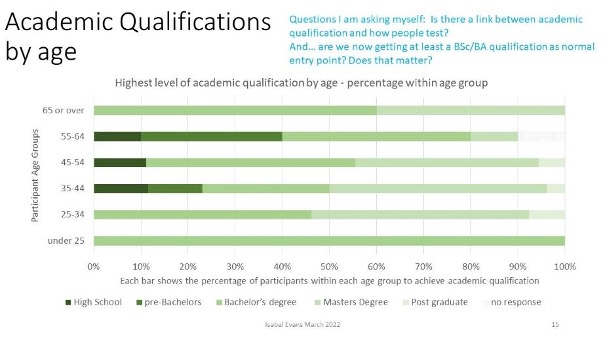
Figure 8 Participants’ Qualifications by Age Range (2022 data)
The backgrounds of the people who have taken part in the research so far are varied. From computer science to international relations, boat building to music education, people work in a range of roles before becoming testers. The word cloud in Figure 7 shows some of the jobs that people in the 2018 survey had before entering testing. Similarly, we can see in Figure 8, which has data from the 2022 survey, that the final academic qualifications range from non-high school graduates to PhDs. It is interesting to note that the people 65 and over, and the people 34 and under all have at least a bachelor’s degree. In contrast, the people between 35 and 64 included non-high school graduates. A follow up question here is to ask when people in the older age groups obtained their degrees – were some of them mature students? Another question is whether experience in a role is equivalent to a degree or other qualification; some participants pointed to their years of experience rather than to their academic qualifications as evidence of professional status. These are both areas I continue to investigate.
People had also had a range of training and qualification opportunities as part of their testing roles. Some participants reported they had had no training in testing, some were self-taught or learned via conferences and online courses, and respondents had also attended a range of courses such as ISTQB, BBST, TMAP, ITIL. I’m still analyzing this data to see whether there are any trends or patterns in people’s background, training, and the approaches they take.
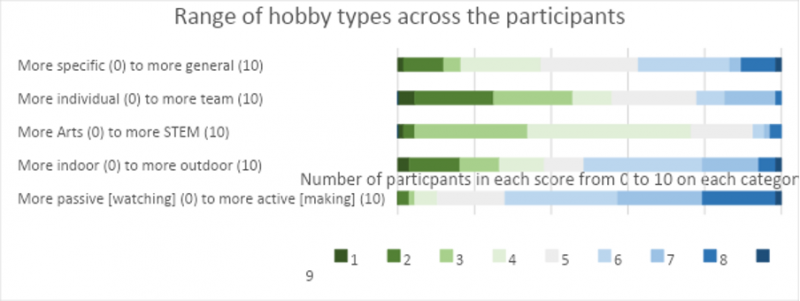
Figure 9 Participants’ Hobbies Grouped and Compared
Some intriguing data is emerging about people’s hobbies. In Figure 9, I show the results of analysis of the responses to an open question about hobbies and pastimes outside work. I’ve analyzed these to show five range statements about hobbies. These are: (1) very specific hobbies (e.g. numismatics) versus very general statements (e.g. sport), (2) more individual pastimes (e.g. solo hiking) through to team/group activities (e.g. singing in a choir), (3) more arts-oriented (e.g. painting) to more STEM-oriented (e.g. astronomy), (4) more indoor (e.g. cooking) to more outdoor (e.g. bird watching) and (5) more passive (e.g. watching movies) to more active (e.g. making bread, composing music). If you look at the ranges across the graph, you can see that testers are evenly spread across specific to general statements about hobbies, across a preference for individual to group activities, and across indoor to outdoor pursuits. There does seem to be a leaning towards arts activities, and towards active/making hobbies rather than passive/watching hobbies. I’m working on this in follow-up to the survey—are people’s hobbies indicative of any qualities they bring to their work? Do people’s hobbies align to or complement their preferred working practices? These are still open questions.
I asked participants in the 2022 survey about their job titles, and whether those matched their actual responsibilities. Some people have incredibly complex responsibilities, with multiple lines of communication, multiple tasks, and not a close match between their job title and their activities. This is another indicator that testers are not “Just a tester”.
Continuing to Explore…
As you can see, this really is an interim report. I’m still collecting and analyzing data, as well as modeling the PEDF. At each stage of this iterative and exploratory process, the questions I ask and the models I build are driven by the data I’ve discovered so far. I’ll be asking you—industry practitioners and experts—to review what I have done, contribute your ideas and questions, to help validate and verify the work. If you want to know more, or to take part, please contact me on [email protected].
Survey links are here: https://wordpress.com/post/isabelevansconsultancy.wordpress.com/320


Lets Hang!