Developing a comprehensive test suite for large-scale programs with end-to-end functional impact—spanning Sales, Customer Care, Technical Support, Supply Chain, Accounting, and Servicing—is traditionally a manual, time-intensive process. Each functional team contributes scenarios based on their domain expertise, requiring significant coordination at the test management level to consolidate these into a unified suite. However, this approach often fails to reflect real-world business activity. For instance, a test case may prioritize a specific country-product combination that sees little to no actual usage in production.
This article proposes a revolutionary shift: using unsupervised machine learning to transform raw production data into an optimized set of test scenarios.
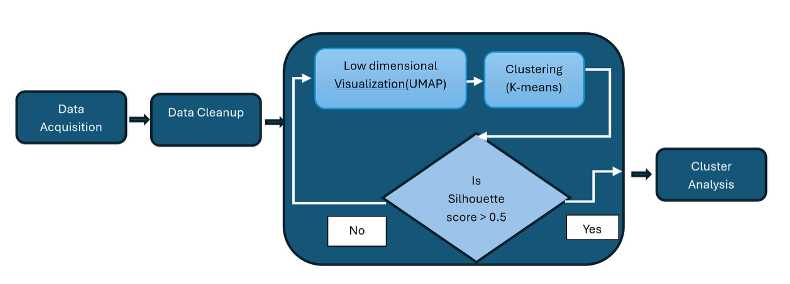
We will explore a five-stage workflow:
- Data Acquisition and
- Cleanup to prepare our inputs;
- Low-Dimensional Visualization (UMAP) to see the data structure;
- Clustering (K-Means) to segment the records; and
- Cluster Analysis to finalize the test suite.
By the end of this guide, you will understand how to move from "production chaos" to a statistically validated, highly efficient testing strategy.
Let’s review the proposed step-by-step methodology for transforming your production data into actionable test profiles.
Proposed Approach
This proposal advocates a data-driven strategy for constructing test suites, leveraging production transaction data as the foundation. Since this data reflects actual business activity, it offers a reliable starting point for identifying relevant test scenarios. Recent advancements in machine learning enable the transformation of complex, multi-dimensional datasets into lower-dimensional representations, facilitating clearer visualization and analysis. Clustering techniques can then be applied to group similar transactions into meaningful segments. These clusters, when reviewed manually, can yield a concise and realistic set of test scenarios tailored to the specific needs of the project.
Below is the suggested workflow for this approach.
The following steps outline how to execute the workflow for the proposed approach, including key pitfalls to avoid during data preparation.
Data Acquisition
The first step is to construct a dataset that captures the key dimensions across your organization’s functional areas. For a product-based business, relevant dimensions may span departments such as Sales, Finance, Supply Chain, and Accounting. Examples include:
- Geography/Country (e.g., Alabama, Texas, USA, Brazil)
- Customer Segment (e.g., Consumer, Small Business, Enterprise)
- Product/Offer
- Payment Method (e.g., Credit Card, Bank Transfer, Customer Credit)
- Manufacturing Location
- Order Revenue
- Chart of Accounts/Cost Center
- Shipping Method
- Seasonality (e.g., Quarter ID or Week ID)
Careful selection of these dimensions is critical. Redundant or overly granular attributes can degrade the performance of machine learning algorithms, leading to slower processing and skewed clustering results. For instance, capturing both week ID and quarter ID may be unnecessary for seasonality. Similarly, if your product hierarchy includes multiple levels (e.g., Category, Brand, Line of Business), rather than including the entire hierarchy in the data file, choose only a level that works for most stakeholders or a level that is relevant to the key business functions in testing focus.
Data Cleanup
Once the dataset is assembled, the next step is to refine it for analysis. In addition to standard cleaning practices (e.g., removing nulls, blanks, or N/As), consider the following:
- Outlier Removal for Numerical Dimensions: Use scatter plots or statistical methods to identify and exclude outliers. These anomalies can distort clustering results and reduce model accuracy.
- Class Balance in Categorical Dimensions: Ensure a balanced distribution across categories. If a dimension is heavily skewed toward a single class (e.g., 90% of transactions using Credit Card as the payment method), consider excluding it from the clustering process. Such dominant classes can overshadow meaningful patterns. However, these dimensions may still be useful when interpreting or validating the final test scenarios and hence these classes need to be included back before publishing the test suite.
- Duplicate Record Elimination: Remove duplicate entries. Pay special attention to dimensions like Order Revenue, which may vary slightly across otherwise identical records. In such cases, consider excluding revenue from the duplication check to avoid unnecessary data loss.
Low-Dimensional Visualization
Even after thorough cleaning, transaction datasets often remain high-dimensional, making pattern recognition difficult through conventional visualization techniques. Fortunately, modern machine learning methods such as UMAP (Uniform Manifold Approximation and Projection) allow for dimensionality reduction while preserving the structure of the data.
UMAP projects multi-dimensional data into a two-dimensional space, enabling visual identification of potential clusters. This initial view can guide further analysis, but it may require iterative tuning of UMAP parameters—such as n_neighbors—to achieve clearly separated and interpretable clusters.
A key advantage of UMAP is its ability to handle mixed data types (both continuous and categorical), which is common in real-world business datasets.
Clustering
Building on the insights gained from low-dimensional visualization, the next step is to formally segment the data into clusters. For datasets with mixed data types, the K-Means algorithm has proven effective. It operates on the two-dimensional coordinates generated by UMAP and uses the specified number of clusters to group data points based on proximity.
This process is inherently iterative. Parameters such as n_clusters may need to be adjusted until each cluster is clearly distinguishable and meaningful.
To evaluate clustering quality, the Silhouette Score is a widely accepted metric. It measures how similar a data point is to its own cluster compared to other clusters, producing a score between -1 and 1. A score above 0.5 typically indicates well-defined clusters. If the score is lower, it may be necessary to revisit the UMAP step and fine-tune parameters like n_neighbors.
Once clustering is complete, the input dataset can be enriched with cluster labels, setting the stage for deeper analysis.
Cluster Analysis
With clusters now identified and labeled, the next step is to interpret their significance. By analyzing the characteristics of each cluster, we can uncover what differentiates one group of transactions from another. In many cases, a single dimension—such as customer segment, product type, or shipping method—may be the primary driver of variation within a cluster.
This insight presents an opportunity to optimize the test suite. If multiple records within a cluster differ only slightly, they can often be consolidated into a single, representative test scenario. This not only reduces redundancy but also ensures that the final test set remains aligned with real-world usage patterns.
A Case Study
Below is a case study undertaken following the above process. This dataset was modeled out of transaction data used in a typical retail business.
Now let us briefly understand the dimensions of the data set used.
Dimension Name | Number of Classes | Example |
|---|
Country | 22 | USA, Belgium, Canada |
Manufacturing Facility | 29 | A 3 character code |
Offer | 11 | Hardware Only, Hardware+ Software etc. |
Business Unit | 3 | Consumer hardware or Enterprise hardware or third party |
Customer Segment | 31 | Consumer, Commercial, Small Business, Government etc. |
Purchase Channel | 14 | Online, Offline, B2B, Member Purchase etc. |
Payment Method | 9 | Credit Card, Customer Credit, Bank Payment, third party funding etc. |
Product | 17 | Laptop, Server, Display etc. |
Shipping Method | 44 | Standard, Priority, Customer Pickup etc. |
Transaction Quarter | 4 | Quarter 1, Quarter 2 etc. |
Cost Center | 266 | A 6 digit numeric code |
The original data set had around 20K records. However, after removing the order revenue from duplicate analysis, the total dataset collapsed to 3800. While Order Revenue is arguably a valuable dimension, the benefits here outweigh the shortfalls.
Below is the result of Cluster patterns identified by the UMAP and K-Means algorithms. The results were generated after iterating through several combinations of n-neighbors (UMAP) and n-clusters (K-Means).
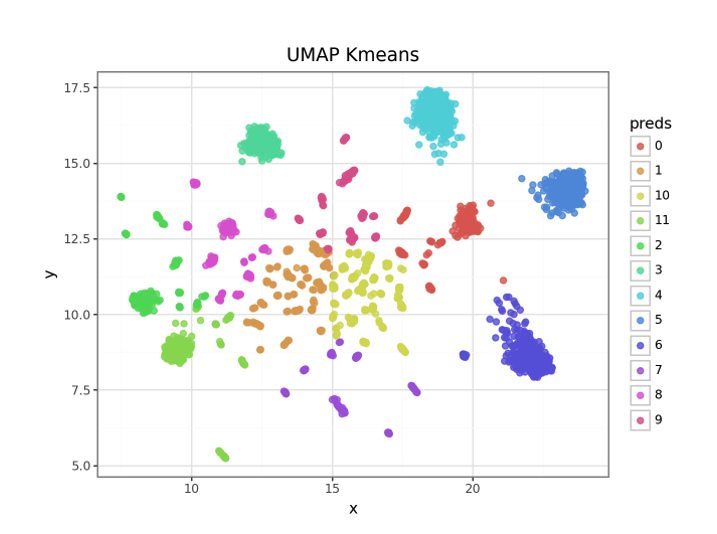
As you can see, there are at least 8 to 10 clearly distinguishable clusters identified.
The Silhouette Score is 0.595 and tells us we have reasonably good quality clusters.
Cluster Analysis
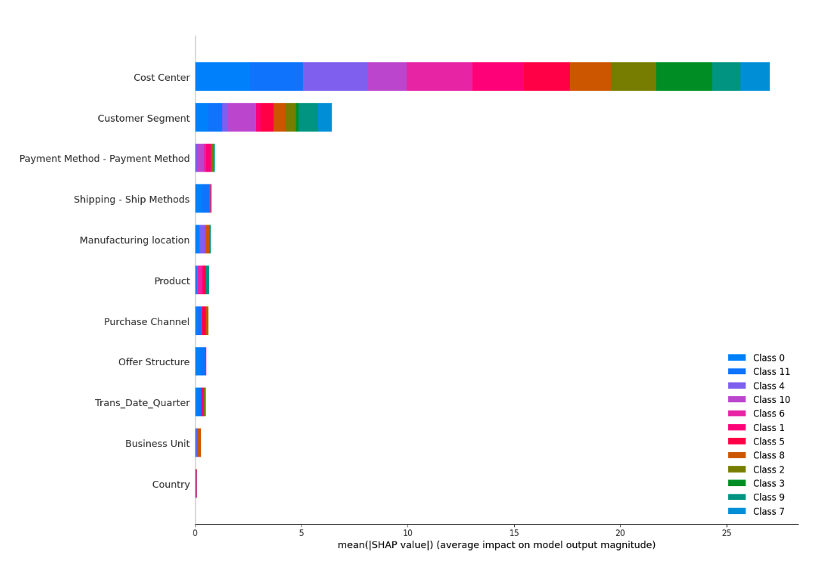
At a high level, clustering seems to be largely driven by Cost Center followed by Customer Segment.
- Each cluster has a balanced distribution of data points. A useful metric to evaluate this balance is the Coefficient of Variation (CV), defined as the ratio of the standard deviation to the mean. Ideally, the CV should be as small as possible to indicate uniform density across clusters. In practice, a CV within the range of 20–30% is considered acceptable.
Below is a table that shows the count of data points across clusters.
Cluster Id | Number of Data Points |
|---|
4 | 457 |
6 | 443 |
5 | 390 |
11 | 343 |
10 | 342 |
3 | 333 |
0 | 293 |
2 | 285 |
8 | 280 |
1 | 271 |
9 | 221 |
7 | 191 |
Based on the counts provided, we obtain an average of 321 data points and a standard deviation of 78, resulting in a CV of 24% which is in acceptable range.
The next step is to have functional experts review the clusters to assess whether they can be consolidated. While the machine learning algorithm separated the clusters based on spatial differences across data dimensions, many of these distinctions can be driven by only one or two variables. Subject matter experts can evaluate whether such differences are truly significant, and identify opportunities to merge clusters that are not meaningfully distinct.
For example, in the case above, clusters 4, 5, and 6 are primarily differentiated by a small set of Cost Centers. Since the Accounting department is most closely aligned with this dimension, they can determine whether these Cost Centers should be prioritized or streamlined. If so, the three clusters could be collapsed into a single, more coherent cluster.
Conclusion
In this article, we demonstrated how raw transaction data can be refined and visualized through UMAP to reveal hidden patterns. By applying K-Means clustering and validating the results with a Silhouette Score, we showed how thousands of records can be distilled into a few high-value test cases.
Transitioning from manual scenario design to unsupervised machine learning techniques, such as UMAP, offers a powerful new lens for exploring transaction data, uncovering hidden patterns, and testing what actually matters. These insights can be instrumental in designing a test suite that is both optimized and reflective of actual business operations.
Rather than relying solely on traditional, manual approaches, test managers and strategists are encouraged to apply these data-centric methods early in the test planning process. Doing so can lead to more efficient, targeted, and realistic test scenarios -ultimately improving coverage, reducing effort across functional teams, and reflecting the real-world environment.
References
Great article on Clustering Mixed Data with python code.
https://medium.com/analytics-vidhya/the-ultimate-guide-for-clustering-mixed-data-1eefa0b4743b
UMAP Documentation
https://umap-learn.readthedocs.io/en/latest/


Lets Hang!