Summary
We call them “estimates” rather than “accurate predictions of the future” because of uncertainty. Failing to convey uncertainty often contributes to misunderstanding.

We call them “estimates” rather than “accurate predictions of the future” because of uncertainty. Failing to convey uncertainty often contributes to misunderstanding.
The basic estimation process involves developing a model that helps predict a value, then gathering data where we can, making assumptions where we must, and committing arithmetic. This usually results in what is called a “single point” estimate.
Example:
Los Angeles is about 400 miles from my house (data). If I assume an average driving speed of 50 MPH and two 30-minute stops for fuel, food, and biology then it would take about:
(400/50=8 hours) + (2 x 30=1 hour) = 9 hours to drive from my house to Los Angeles.
That is not a guarantee that it will take 9 hours, but it is a reasonable guess. If I’m making this estimate three weeks before the trip, I might want to stipulate that this estimate assumes no exceptional road work, weather, or traffic—because that information is not available right now.
This simplistic approach would be an improvement for people who don’t know where to begin when asked for an estimate, but it doesn’t give the person receiving the estimate any idea of variability or confidence. Is the journey likely to require 9 hours plus or minus 10 minutes, or 9 hours plus or minus 2 hours?
Additional information can be provided by developing a range estimate. Perhaps I could tell my friend in L.A. that I expect to arrive between 5pm and 9pm, barring surprises. This would help them plan their day (I know that in the age of cell phones I could give my friend hourly updates, but that’s not the point I’m trying to make here).
An alternative approach asks for 3-Point Estimates. Instead of requesting one estimate predicting the cost or schedule of a piece of work, ask for three:
The three-point estimate relieves the estimator from the pressure of trying to accurately predict the future and instead asks for a range of possibilities they think are credible, based on their experience and the best information available.
This reinforces for both the estimator, and anyone reviewing the estimate that estimation is not an exact science. It also calls attention to tasks where the team has significant uncertainty (tasks with a large spread between the best and worst cases). This method encourages a conversation about what, if anything, can be done to reduce that uncertainty (prototyping, further research, more design, etc.).
We can visualize 3-point estimates as a chart that might look something like this:
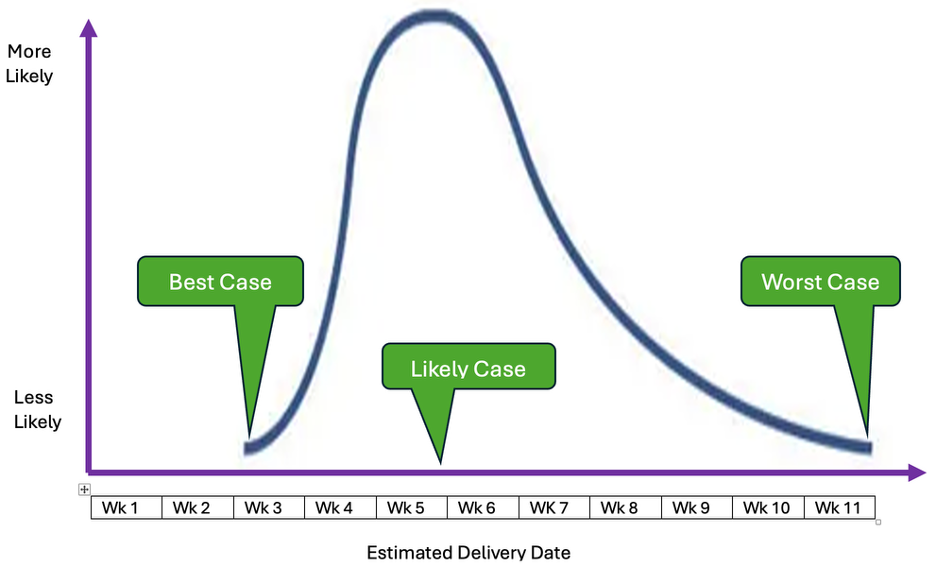
When presenting estimates to executives it’s useful to provide both context and confidence.
Context involves explaining the sources of data used to generate the estimate as well as assumptions that underlay the estimate.
Confidence attempts to explain how likely the prediction is close/correct.
If you are asked when a project will be completed, saying “June 8th” communicates neither context, nor any measure of confidence. In my experience, this often leads to miscommunication. Most executives are likely to mark their calendars for June 8 and move on. If the project is not completed June 8th, the executive may feel misled.
Contrast that with a point estimate like this: “If we don’t get excessive rain or experience unusual issues procuring materials then, barring surprises, based on our experience with similar efforts we think there is a 70% chance that construction will be completed and the house ready for move-in on June 8th.”
A range estimate could be: “If we don't get excessive rain and there are no unusual issues procuring materials then, barring surprises, based on our experience with similar efforts we believe that there is a 75% chance the house will be ready for move-in between June 1st and June 22nd.
And here is a 3-point estimate: “If we don't get excessive rain and there are no unusual issues procuring materials then, barring surprises, based on our experience with similar efforts we believe the best case is that the house will be ready May 25th, the most likely case is that it will be ready June 8th, and the worst-case would-be July 20th.”
When possible, this data might be presented in a chart that would look something like this:
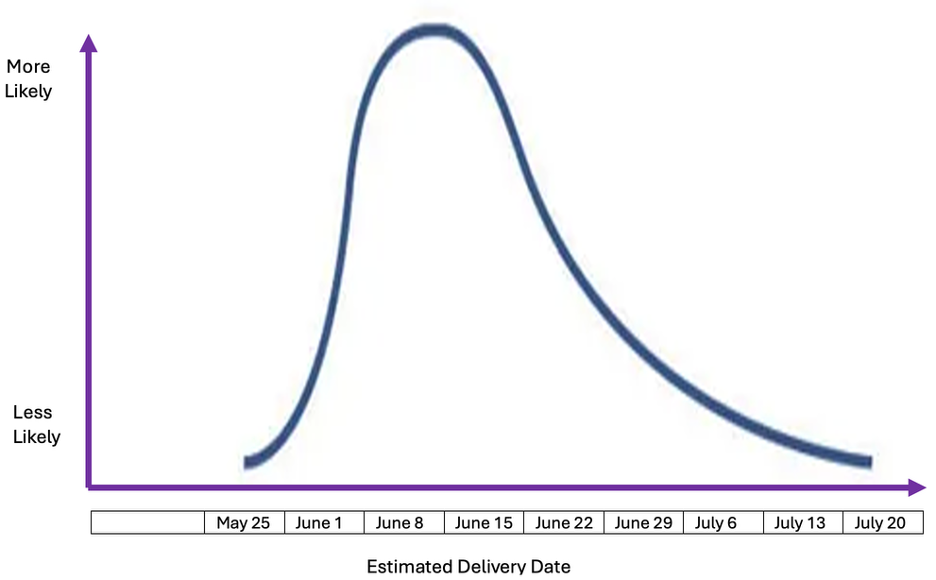
This is a useful picture to share because it gives a sense of our confidence in the estimate.
I believe pictures of this type would be helpful to executives trying to understand when something will be delivered (or how much it will cost) and likely encourages a conversation about the uncertainty underlying the estimate and what might be done to reduce that uncertainty.


Lets Hang!